Multiple Choice
Figure 13.3
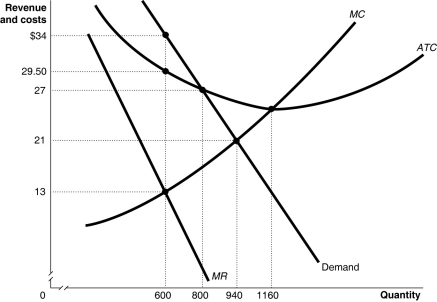
Figure 13.3 shows the demand and cost curves for a monopolist.
-Refer to Figure 13.3.What is the amount of the monopoly's total revenue?
Definitions:
Related Questions
Q29: In monopolistic competition, if a firm produces
Q36: If, at the firm's projected sales level,
Q47: Which of the following is most likely
Q57: Refer to Table 12.1.What is the Nash
Q71: Refer to Figure 10.4.If the market price
Q85: Refer to Figure 10.6.At price P₃, the
Q89: Unlike firms that sell stock in financial
Q116: What is the substitution effect of a
Q128: Refer to Figure 10.5.The firm's manager suggests
Q132: If total variable cost exceeds total revenue