Multiple Choice
Figure 10-9
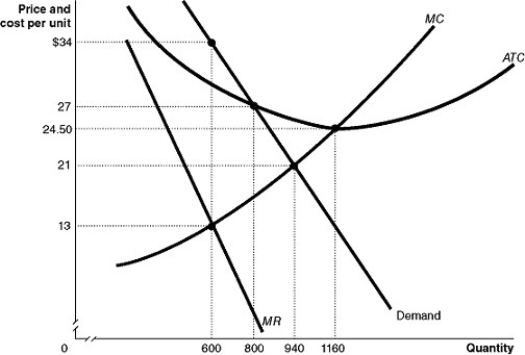 Figure 10-9 shows the demand and cost curves for a monopolist.
-Refer to Figure 10-9.What is the difference between the monopoly output and the perfectly competitive output?
Definitions:
Related Questions
Q62: Firms in perfectly competitive industries are unable
Q68: Merger guidelines developed by the Antitrust Division
Q90: Refer to Figure 9-6.Jason is currently producing
Q124: Identify two ways by which the government
Q134: Refer to Figure 10-18 to answer the
Q148: A merger between the Ford Motor Company
Q179: Which of the following is true of
Q181: "Being the only seller in the market,the
Q216: Refer to Figure 11-11.The firm represented in
Q234: Assume that you observe the long-run average