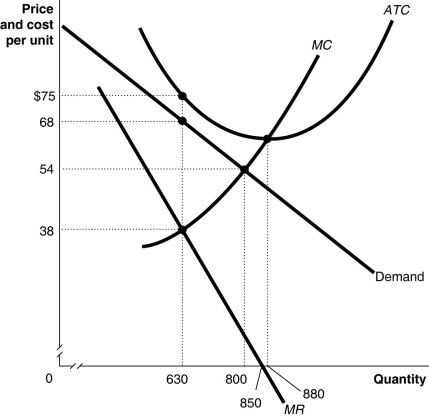
Figure 15-3

Figure 15-3 above shows the demand and cost curves facing a monopolist.
-Refer to Figure 15-3.Suppose the monopolist represented in the diagram above produces positive output.What is the price charged at the profit-maximizing/loss-minimizing output level?
Definitions:
Q49: Market power in the United States causes
Q80: If marginal costs differ quite substantially from
Q104: Which of the following is true for
Q109: Refer to Figure 15-8.Use the figure above
Q115: Assume a hypothetical case where an industry
Q129: The long-run equilibrium in a monopolistically competitive
Q142: A consequence of the quota that has
Q153: In a decision tree, the difference between
Q230: A game in which pursuing dominant strategies
Q237: Monopolistically competitive firms can differentiate their products<br>A)by