Figure 20-8
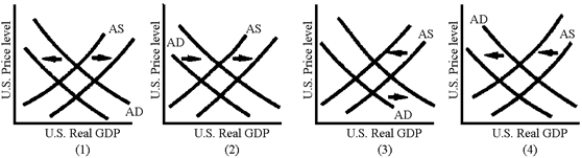
-Which of the graphs in Figure 20-8 illustrates the AD-AS shifts associated with a currency depreciation?
Definitions:
Exclusive Licenses
Agreements granting one party alone the right to sell, produce, or use intellectual property or product.
Tradable Permits
Government-issued rights or allowances that permit the holder to emit a certain amount of a substance; can be bought, sold, or traded.
Common Resource
A resource like air or water that is not owned by anyone, but is available for use by everyone, often leading to overuse and depletion.
Marginal Social Benefit
The extra advantage to the community when one additional unit of a product or service is made.
Q5: The effect of a tariff or a
Q10: In terms of international business, it is
Q15: Dispersing value activities where and in how
Q41: Which of the following BEST describes the
Q50: Which of the following is NOT true
Q59: In the context of value chain analysis,
Q72: Marrin Associates is an MNE with operations
Q74: According to the _ view, a nation's
Q100: Suppose that the citizens of South Dakota
Q178: In Figure 22-7, where AB represents the