Use the figure below to answer the following questions.
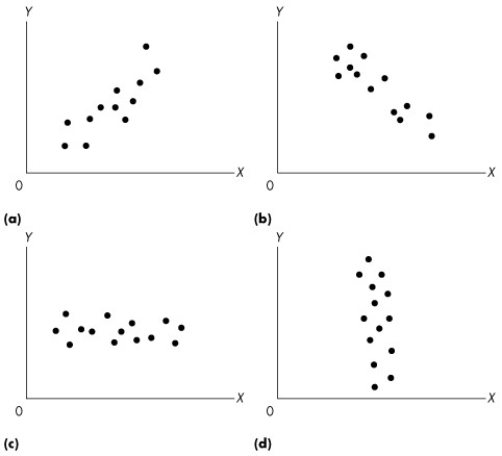
Figure 1A.1.5
-Refer to Figure 1A.1.5. Which graph or graphs indicates a negative relationship between x and y?
Definitions:
Values
Quantitative or qualitative measurements, attributes, or properties of variables or items.
Class Intervals
Ranges of values within which data points are grouped for frequency distribution purposes.
Histogram
A graphical representation of the distribution of numerical data, showing the frequency of data points within specified ranges.
Observations
The collected data points or measurements recorded during a scientific study or research project.
Q22: The price of apples falls by 5
Q56: If Canada imposes a tariff on imported
Q76: In Figure 1A.3.4, the slope across arc
Q105: In Portugal, the opportunity cost of a
Q114: Mexico and Canada produce both oil and
Q121: Given Fact 2.4.2, the opportunity cost of
Q134: The Genius Software Company has developed an
Q143: When a market is in equilibrium,<br>A)there is
Q175: The slope of a horizontal line is<br>A)positive.<br>B)negative.<br>C)zero.<br>D)infinite.<br>E)initially
Q201: The relationship between two variables that move