Multiple Choice
Use the figure below to answer the following questions. 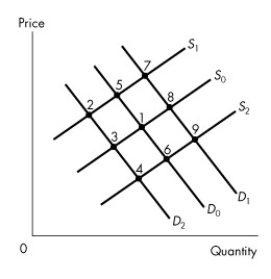 Figure 3.5.2
Original equilibrium at 1.
-Refer to Figure 3.5.2,which represents the market for beans.If the price of peas,a substitute for beans rises,what is the new beans equilibrium,ceteris paribus?
Definitions:
Related Questions
Q6: Refer to Table 4.2.2.The cross elasticity of
Q8: The income effect influences food purchases because
Q38: In a command system, resources are allocated
Q41: Market demand is the<br>A)sum of the prices
Q49: When price rises from $1.50 to $2.50,
Q59: You are told that a 5 percent
Q71: The production possibilities frontier<br>A)is the boundary between
Q95: If the price of a good is
Q125: A 3 percent rise in the price
Q128: Initially, the demand curve for good A