Multiple Choice
Use the figure below to answer the following question.
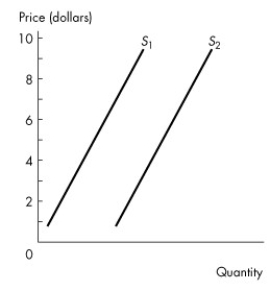
Figure 4.3.1
-The two supply curves in Figure 4.3.1 are parallel. Between $7 to $8,
Definitions:
Related Questions
Q6: If A and B are substitutes and
Q8: Refer to Figure 7.3.1.Canadian producers' _ from
Q15: If the demand for a good is
Q15: Which of the following lead to an
Q42: Refer to Table 8.2.3.To attain consumer equilibrium,
Q84: The economy illustrated by the data in
Q98: The price elasticity of demand is a
Q101: If A and B are substitutes and
Q169: If a price decrease results in an
Q177: Refer to Table 3.4.1.If the price is