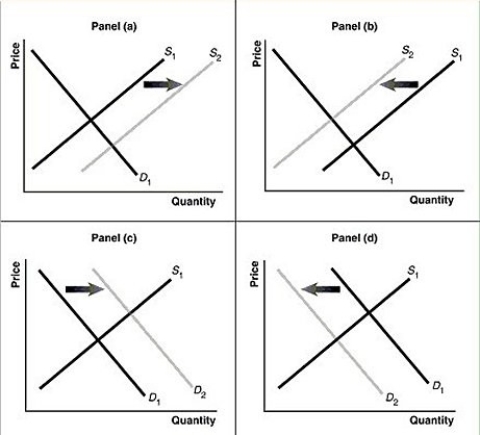
Figure 3-7

-Refer to Figure 3-7.Assume that the graphs in this figure represent the demand and supply curves for women's clothing.Which panel best describes what happens in this market when the wages of seamstresses rise?
Definitions:
Customers Served
The number of customers who receive service or products from a business during a specific time period.
Flexible Budget
A budget that adjusts or flexes with changes in volume or activity levels, allowing for more accurate budgeting in variable cost scenarios.
Patient-Visits
A measure used in healthcare to denote the number of times patients see a healthcare provider or visit a healthcare facility.
Revenue
The sum of money a company earns from its sales of products or services before deducting any costs.
Q1: Refer to Table 4-1.The table above lists
Q20: Refer to Table 2-8.South Korea has a
Q39: Refer to Figure 4-1.If the market price
Q43: Consider the following items:<br>A.the novel "The Girl
Q84: When Congress passed a law that imposed
Q99: A surplus occurs when the actual selling
Q116: If a country is producing efficiently and
Q121: An increase in the price of pineapples
Q207: The income effect explains why there is
Q242: If you burn your trash in the