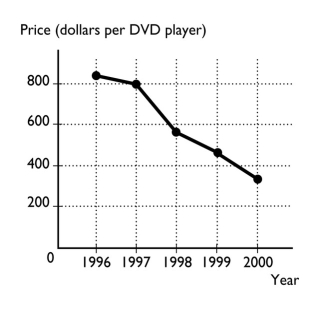
-The figure above shows the price of a DVD player from 1996 to 2000.
a.What type of graph is illustrated above?
b.What is the trend in the price of a DVD player?
Definitions:
Decrease in Demand
A condition where consumers show less interest in purchasing a product, leading to a leftward shift in the demand curve.
Substitute Goods
Products or services that can be used in place of each other, offering consumers choices when making purchases.
Bumper Crop
An unusually large harvest of crops in a given season.
Equilibrium Price
The price at which the quantity of a good demanded by consumers equals the quantity supplied by producers, resulting in a stable market condition.
Q12: In the circular flow model, the factors
Q26: Dividing the nation's income among the factors
Q34: What is the slope of the line
Q57: The figure above shows the relationship between
Q81: The current account balance is<br>A) -$100 billion.<br>B)
Q91: For country Gamma the opportunity cost for
Q149: Dan missed class the day the professor
Q184: During 2009, a country reports imports of
Q199: The above figure shows how many pounds
Q270: Given the information in the figure above,