The eight climographs below show yearly temperature (line graph and left vertical axis) and precipitation (bar graph and right vertical axis) averages for each month for some locations on Earth. Choose the climograph that best answers the questions or completes the statement. Climographs may be used once, more than once, or not at all.
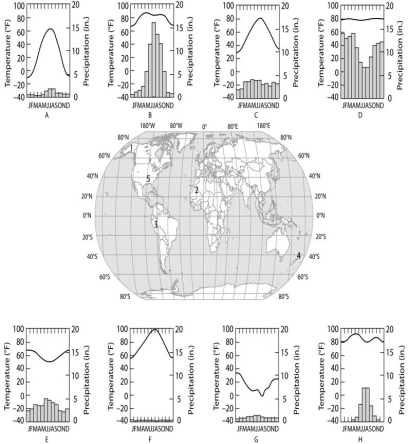
-Which of the following best substantiates why location 3 is an equatorial (tropical) climate?
Definitions:
Agreeableness
One of the five major personality traits, reflecting individual differences in cooperation, compassion, and social harmony.
Caring
Displaying kindness and concern for others.
Introversion
A personality trait marked by a focus on internal thoughts and feelings rather than seeking external stimulation.
Extraversion
Extraversion is a personality trait typified by outgoingness, high energy, and sociability.
Q4: Secondary consumers that can eat only primary
Q11: Which of the following is a conclusion
Q16: Which of the following characteristics is associated
Q21: Contact of a sperm with signal molecules
Q22: During exponential growth, a population always<br>A)grows by
Q25: Extraembryonic membranes develop in<br>A)mammals, but not birds
Q44: What is the normal imprinting stimulus to
Q48: Preparation for the fight-or-flight response includes activation
Q64: Which of the following best describes "game
Q85: An open space within the gastrula is