Multiple Choice
In Figure 3.2, the solid line depicts normal hemoglobin. 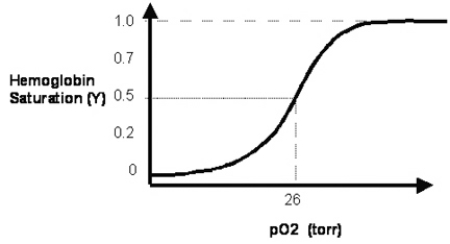 How does the normal curve change when the 2,3-bisphosphoglycerate (2,3-BPG) concentration is reduced?
Definitions:
Related Questions
Q2: Most microsatellites have high mutation rates, and
Q3: A patient presents in the emergency room
Q4: In quality control there are two major
Q8: Elevations in the plasma level of which
Q9: Fetal hemoglobin has a somewhat higher oxygen-binding
Q19: Which of the following characteristics makes it
Q26: Which of the following arguments best describes
Q31: In order to leverage the location decision
Q77: Identify the American state that first introduced
Q80: What is the percentage of incumbent governors