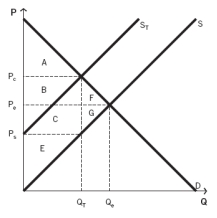
Use the following information to answer the next fifteen questions.
The following graph depicts a market where a tax has been imposed. Pₑ was the equilibrium price before the tax was imposed, and Qₑ was the equilibrium quantity. After the tax, PC is the price that consumers pay, and PS is the price that producers receive. QT units are sold after the tax is imposed. NOTE: The areas B and C are rectangles that are divided by the supply curve ST. Include both sections of those rectangles when choosing your answers.

-Which areas represent the amount of consumer surplus lost due to the tax?
Definitions:
Breccia
A type of rock composed of broken fragments of minerals or rocks cemented together by a fine-grained matrix.
Conglomerate
A sedimentary rock composed of rounded clasts of varying sizes cemented together by a matrix.
Shale
A fine-grained clastic sedimentary rock formed by the consolidation of clay and other fine-grained material.
Well Sorted
Describes sedimentary particles that are uniform in size, indicating a specific and stable environment of deposition.
Q12: A tax creates no deadweight loss only
Q34: Which allocation point in the short-run production
Q49: Which of the following individuals would NOT
Q61: The accompanying figures depict the production possibilities
Q61: Which areas represent the amount of producer
Q66: Using a supply and demand model,show what
Q80: The Great Depression lasted most of which
Q89: What is DiNozzo's opportunity cost of making
Q91: The phase of the business cycle where
Q130: What is Gibbs's opportunity cost of making