Refer to the following graph to answer the following questions: 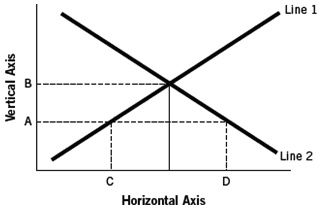
-Assuming the figure represents the market for loanable funds,and that point C represents $40 million and point D represents $70 million,then it would be true that
Definitions:
Excessive Profits
Earnings that significantly exceed the norm for a industry or market, often viewed critically in terms of business ethics or competition fairness.
Equivalent Risk
A concept in finance and investments referring to two or more investment options that have the same level of risk.
Hypercompetition
A condition in the market characterized by rapid and intense competitive moves, where advantages are quickly eroded.
Intermittent Profits
Earnings that are not consistent or regular, often fluctuating due to various external or internal factors.
Q23: The graphical relationship between real gross domestic
Q39: When the value of a resource declines
Q81: Between 1960 and 2012,the average unemployment rate
Q84: What was the GDP deflator in 2012?<br>A)
Q88: When firms seek funding to pay for
Q100: According to the table,the labor force participation
Q120: Banks:<br>A) are the only type of financial
Q134: Consider the data in the following table.<br><img
Q140: You are given the following information about
Q141: According to the table,the employment rate in