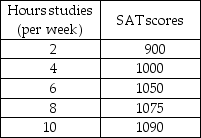

-Jamie is preparing to take his SAT tests. The table above shows how Jamie's score depends on the number of hours a week Jamie studies.
a) Plot the relationship in the figure, putting the hours studied on the horizontal axis.
b) Is the relationship you plotted positive or negative?
c) What happens to the slope of the relationship as hours studied increase?
d) Suppose Jamie can enroll in an SAT prep course and, by so doing, for every possible number of hours he studies, his score will be 100 points higher. Plot the new relationship between the number of hours studied and Jamie's SAT score in the figure.
e) How many variables are involved in the figure you just completed?
Definitions:
Production Departments
Units or areas within a manufacturing facility where specific parts of the production process are completed.
Job-order Costing
An accounting method that tracks costs individually for each job, suitable for bespoke or custom orders.
Predetermined Overhead Rate
A rate calculated before a period begins, based on the estimated overhead costs and activity levels, used to allocate overhead costs to products.
Direct Materials Cost
The cost of raw materials that are directly used in the production of goods, which is easily traceable to the finished product.
Q10: The labor force is defined as<br>A) all
Q88: In the above,as the y variable increases<br>A)
Q206: Which of the following questions is NOT
Q230: Anna and Maria produce shirts and ties.The
Q237: Refer to the table above,which gives five
Q284: Differences in income are most directly related
Q321: Opportunity cost is illustrated in a production
Q369: In the United States,the government coordinates most
Q418: Employees at Bank of America are good
Q464: Using the data in the above table,if