The figure given below represents the total output and price produced in an oligopoly market characterized by a dominant firm and a fringe.SF represents the supply curve of the fringe, D is the market demand curve, DRES represents the residual demand curve of the dominant firm, MRRES represents the residual marginal revenue curve of the dominant firm, and MCD represents the marginal cost of the dominant firm.
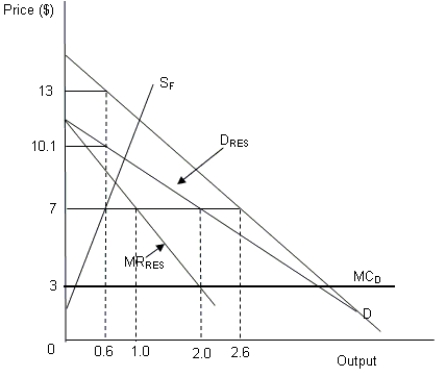
-Refer to Figure .What will be the fringe's profit maximizing output?
Definitions:
Low Risk
Situations or investments that have a minimal chance of loss or failure.
High Risk
refers to situations or activities with a high potential for loss or danger, often in the context of investments or decisions.
Insurance
A financial product that provides protection against possible future losses in exchange for a premium.
Adverse Selection
A situation where asymmetrical information leads to a mismatch between buyers and sellers, with one party having more or better information than the other.
Q15: A monopolist faces a horizontal demand curve
Q18: Assume that in a price-fixing game, if
Q23: The arrival of inexpensive information technology, such
Q39: What is a hierarchy?
Q46: Discuss the relation between average variable cost
Q47: Value-creating contracts require underlying laws that:<br>A)clearly define
Q52: How is the optimal level of input
Q59: A company X is unlikely to disclose
Q66: Why do some unitization contracts require landowners
Q68: What encryption mechanism can be used for