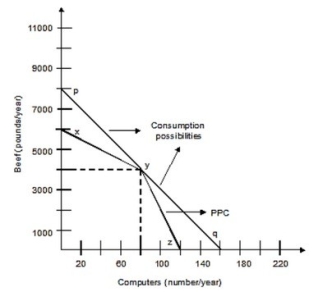
The following graph shows the production possibilities curve for the economy with only two members, Silvia and Art. Silvia can produce either 50 pounds of beef or 2 computers per week, and Art can produce 100 pounds of beef or 1 computer per week. Both of them work 40 weeks per year.  If both Art and Silvia worked full-time producing beef, how many pounds of beef can they produce per year?
Definitions:
Decreasing-Cost Industry
An industry where production costs decrease as the industry grows, often due to economies of scale.
Long-Run Equilibrium
A state in which all factors of production and costs are variable, allowing firms to make adjustments such that supply equals demand, and no economic profits are earned.
Increased Demand
A situation where the desire or need for a product or service grows, often leading to higher sales or consumption.
Pure Competition
A market structure characterized by a large number of small firms, a homogeneous product, and easy entry and exit from the market.
Q2: If this is an open economy, the
Q75: Jen is offered a job answering the
Q91: There are 20 residents in the village
Q97: Government polices aimed at changing the underlying
Q115: Suppose that there are two types of
Q124: Output per employed worker is called:<br>A)total output.<br>B)average
Q136: Opening this economy to trade would benefit
Q150: Output per person must be _ output
Q158: The use of pollution permits by the
Q160: The following graph shows the production possibilities