Exhibit 11-2: The following means (graphs a - e) show some possible outcomes of a study investigating the relationship of two handwriting instruction methods, A and B, on the handwriting scores of boys and girls.The scale on the left shows dependent variable scores.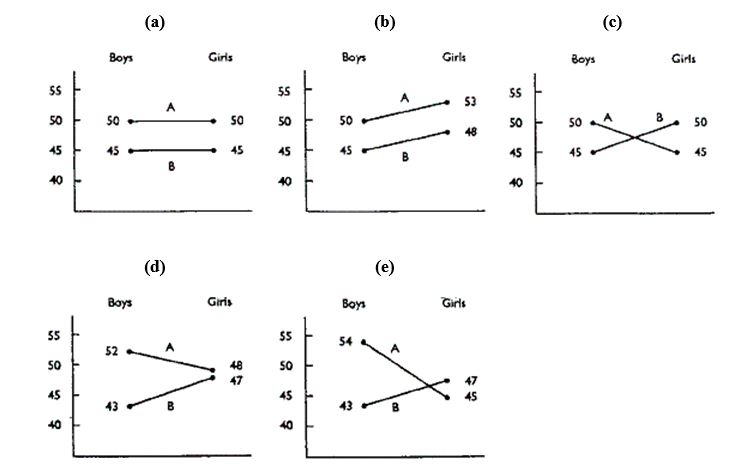
-Refer to Exhibit 11-2.Which diagram shows interaction but no gender or method difference?
Definitions:
ANOVA
A statistical method used to determine the presence of significant differences between the means of three or more independent groups.
Observations
Data collected or measured from a study or experiment regarding individuals, subjects, or phenomena.
Degrees of Freedom
The total number of individual values or figures that a statistical distribution can possess.
Interaction
In statistics and experiments, it refers to a situation where the effect of one variable on an outcome is modified by the level or presence of another variable.
Q3: Refer to Exhibit 7-7.What is the F
Q4: Which is more characteristic of qualitative research?<br>A)
Q12: Why is matching students from two different
Q16: Scholastic aptitude tests are useful in schools
Q36: Refer to Exhibit 10-10.Students who had low
Q50: Identify an advantage of the randomized subjects
Q54: A researcher wishes to predict those college
Q58: A researcher found significantly different mean scores
Q59: Refer to Exhibit 10-2.One group had been
Q91: The internal validity threat that randomization eliminates