The figure given below shows the demand curves (D1 and D2) and supply curves (S1 and S2) of labor in the labor market. Figure: 15.2 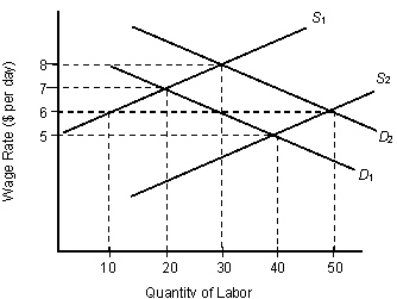
- Refer to Figure 15.2.At the initial equilibrium (when demand is D1 and supply is S1) ,the wage rate and labor employment are:
Definitions:
Perfect
To bring something to a state of completeness or flawlessness; in legal and financial contexts, to finalize or make an action legally binding.
Collateral
An asset offered to secure a loan or other credit, which can be seized by the lender if the loan is not repaid.
Automatic-Perfection Period
A specified timeframe following the attachment of a security interest during which the interest is considered perfected without filing.
Perfected
In legal and financial contexts, refers to having completed all necessary legal steps to enforce rights regarding a security interest against third parties.
Q4: Shane holds wealth worth $10,000.He considers investing
Q7: Which of the following would not reduce
Q40: Proponents of comparable worth justifies it on
Q42: The import demand curve shows the amount
Q45: Direct payments for medical care consist of
Q48: A decline in the interest rate will
Q63: Refer to Table 19.2.The example of
Q66: According to Figure 16.2,what will be
Q74: Privatization of the social security system would
Q92: Refer to Figure 20.1.If the price