The following figures show the demand (D) and supply (S) curves of micro and macro economists. Figure 15.7 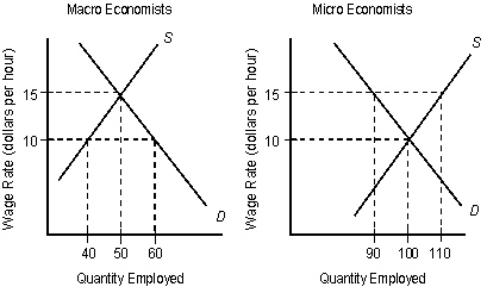
- In Figure 15.7,assume that the wage rates of the micro and the macro economists are determined by the aggregate demand and supply curves.The levels of employment for micro- and macro economists are _____ and _____ respectively:
Definitions:
Compounded annually
This term describes the process of calculating interest on both the initial principal and the accumulated interest from previous periods, done once every year.
Rate of inflation
The percentage increase in the general price level of goods and services in an economy over a period of time.
Purchasing power
The value of a currency expressed in terms of the amount of goods or services that one unit of money can buy.
Compounded monthly
A method where interest is calculated on the principal and any accumulated interest each month, effectively increasing the amount on which future interest is earned.
Q2: For which of the following goods will
Q16: It has been argued that a worker
Q28: Markets can function efficiently only when the
Q30: Problems of moral hazard and adverse selection
Q36: When there exists a negative externality in
Q39: Foreign aid should be given to all
Q42: According to Figure 15.4,one of the possible
Q74: Privatization of the social security system would
Q77: A college student's choice of a major
Q98: Consider the monopolistically competitive firm described in