The figures given below show the demand (D) and supply (S) curves of labor in two different markets. Figure 15.3 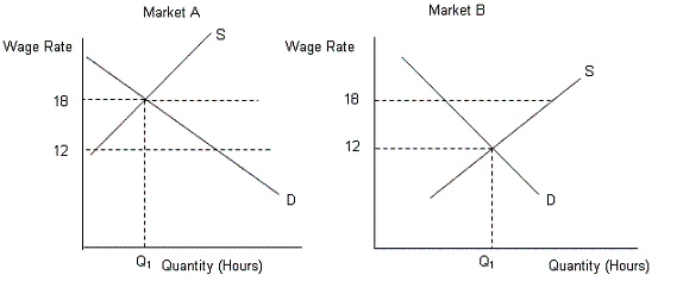
-Refer to Figure 15.3.If the wage rates in market A and market B were set at $15,then:
Definitions:
Value of Marginal Product
The additional revenue generated by employing one more unit of a factor of production, such as labor.
Marginal Product
The increase in output resulting from a one-unit increase in the input of a production factor, holding all other inputs constant.
Marginal Cost
The increase in total cost that arises from an extra unit of production.
Labor-supply Curve
A graphical representation showing the relationship between the quantity of labor supplied and the wage rate.
Q5: The idea of comparable worth implies that
Q38: In the United States,monopoly regulation began primarily
Q52: Assume that any given percentage of the
Q60: Which of following would help minimize moral
Q61: A firm decides to hire more equipments
Q74: Privatization of the social security system would
Q86: If the Gini co-efficient for any economy
Q88: A compensating wage differential is a wage
Q92: Tragedy of commons refers to:<br>A)a problem that
Q120: According to Table 13.1,at the social equilibrium:<br>A)4