The following figure represents the equilibrium in the labor markets. Figure 14.4 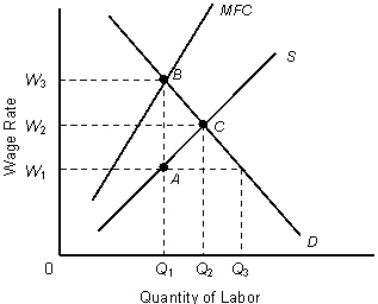 In the figure,
MFC: Marginal Factor Cost curve
D: Demand or the Marginal Revenue Product curve
S: Supply curve
Refer to Figure 14.4.If the government imposes a minimum wage of W2,how many units of labor will a monopsonist hire?
Definitions:
Added Decision-Making Authority
Refers to the increase in power or responsibility given to an individual or group to make decisions affecting organizational activities or processes.
Job Satisfaction
The level of contentment employees feel about their work, which can affect their performance and retention.
Minimum Required Rate Of Return
The lowest acceptable rate of return on an investment, considering its risk and the opportunity cost of forgoing other investments.
Average Operating Assets
The average value of the assets that are used in the normal operations of a business, calculated over a specific period of time.
Q4: The following table shows output per hour
Q9: An increase in economic rent is accompanied
Q19: Which of the following statements about employer
Q29: The European Union Emission Trading Scheme is
Q33: If a monopolist is producing the output
Q38: Firms in monopolistically competitive markets spend significant
Q67: Index mutual funds purchase shares of stock
Q70: In an antitrust lawsuit,which of the following
Q71: A general study of resource markets shows
Q110: The oligopoly market structure model is characterized