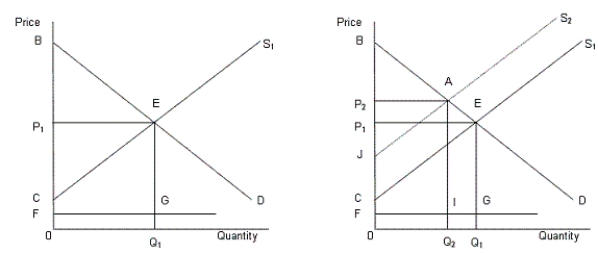
In the following figure, the first panel shows a market situation prior to regulation and the second panel shows the effects of regulation.Figure 14.2
 In the figure,
D: Demand curve for automobiles
S1: Supply curve of automobiles prior to regulation
S2: Supply curve of automobiles after regulation
FG: Clean up cost per unit
-When examining the costs of regulation to the U.S. economy, economists can safely ignore the opportunity costs of regulation because they are relatively insignificant compared with the direct costs of regulation.
Definitions:
Dominant Strategy
A strategy in game theory that provides the best outcome for a player, regardless of the strategies chosen by other players.
Monopoly Outcome
The result or situation where a single company or entity has exclusive control over a particular commodity or service, often leading to higher prices and lower quality.
Nash Equilibrium
A concept in game theory where each player's strategy is optimal, given the strategies of other players, resulting in a situation where no player can benefit by changing strategies unilaterally.
Game Theory
A branch of mathematics and economics that studies decision-making in scenarios where the outcome depends on the actions of multiple agents with potentially conflicting interests.
Q12: Why do skilled workers earn relatively higher
Q18: Bonds are debt securities maturing within 10
Q30: It is often profitable for the white-males
Q41: If the earnings of Chopo Co.are lower
Q48: A market in which adverse selection occurs
Q53: If resource A and resource B are
Q56: Refer to Figure 10.6.Assume that marginal costs
Q71: Refer to Figure 8.3.If the firm maximizes
Q78: The demand curve faced by a perfectly
Q91: An efficient way to move toward the