The figure given below shows revenue and cost curves of a monopolistically competitive firm. Figure: 11.1 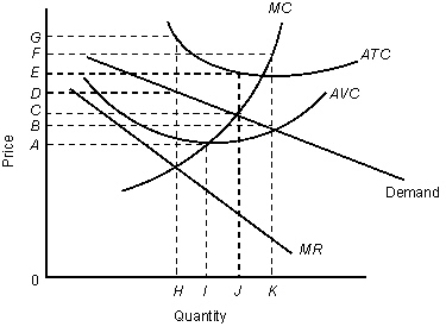 In the figure,
MR: Marginal revenue curve
ATC: Average total cost curve
AVC: Average variable cost curve
MC: Marginal cost curve
-According to Figure 11.1,the firm:
Definitions:
Q2: For which of the following goods will
Q8: Which of the following theories applies to
Q10: According to the Coase theorem,high transaction costs
Q12: The major problem with common ownership is
Q19: When economic activity imposes costs on others
Q26: If the marginal cost exceeds the marginal
Q48: Refer to Figure 9.4.At the profit-maximizing output
Q65: Some competitive firms are willing to operate
Q86: If average variable cost is falling,then:<br>A)average fixed
Q101: To maximize profits in the short run,a