The figure below shows the revenue and cost curves of a monopolistically competitive firm. Figure: 11.2 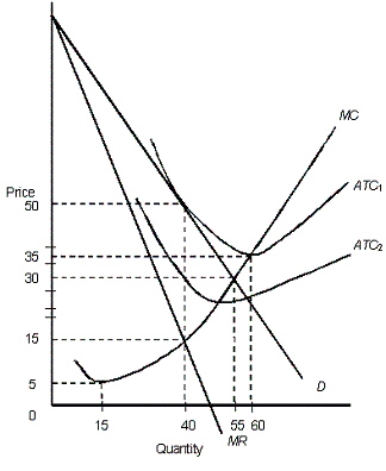 In the figure,
D: Demand curve
MR: Marginal revenue curve
ATC1 and ATC2: Average total cost curves
MC: Marginal cost curve
-In Figure 11.2,assume that the average total cost of the firm is represented by the curve ATC2.In the long run,we would expect:
Definitions:
Giffen Good
A type of inferior good for which demand increases as its price increases, contrary to the typical law of demand.
Slutsky Substitution Effect
A concept in economics that describes how a change in the price of a good affects consumption patterns, separating the effect into income and substitution effects.
Indifference Curve
A graph that shows different combinations of two goods among which a consumer is indifferent, implying the same level of utility for each combination.
Hicks Version
Refers to John Hicks' adaptation of consumer demand theory, particularly in relation to indifference curves and utility maximization.
Q8: According to Table 13.1,at the free
Q28: Above-normal profits earned by existing firms in
Q47: Why do market failures arise in case
Q58: A monopolist's supply curve cannot be derived
Q60: A monopolist always produces on the elastic
Q64: Why has the inequality of income become
Q84: If labor is the only variable input,an
Q85: If a firm is experiencing diminishing returns,then:<br>A)the
Q89: Which of the following wouldhelp to minimize
Q117: Laws that require children to be inoculated