The figure given below shows the demand curve faced by a firm. Figure 10.1 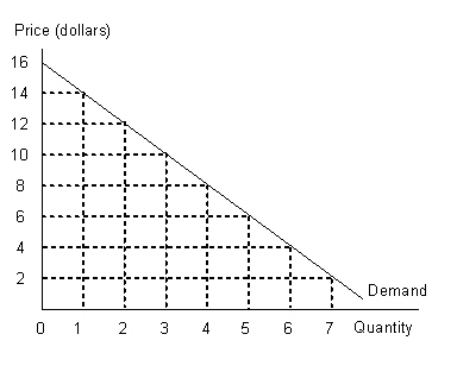 Refer to Figure 10.1 and calculate the revenue gained by the firm when it reduces the price of its product from $8 to $4.
Definitions:
Worker Productivity
The measure of the output of goods or services produced by an employee within a given time frame.
Worker Preferences
The desires or priorities of employees regarding their job conditions, salary, environment, and other job-related factors.
Earning Differentials
The differences in wages or earnings among workers due to various factors such as education, experience, and skills.
Skill Levels
Refers to the range or degree of competencies and expertise possessed by an individual or required for a job.
Q4: The following table shows output per hour
Q25: Which of the following is a characteristic
Q29: The opportunity cost of going to the
Q33: Which of the following entities is able
Q35: If,at the profit-maximizing level of output,a typical
Q39: If a monopolist is producing at the
Q69: Oligopolies can arise as a result of
Q82: If the resource market is perfectly competitive,the
Q88: Why do the perfectly competitive firms earn
Q98: The antitrust laws in the United States