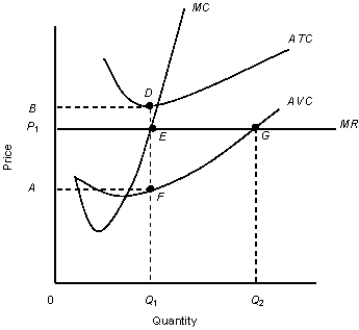
The figure given below shows the revenue and cost curves of a perfectly competitive firm.Figure 10.5
 MC: Marginal cost curve
MR: Marginal revenue curve.ATC: Average-total-cost curve
AVC: Average-variable-cost curve
-Why do the perfectly competitive firms earn only normal profits in the long run?
Definitions:
Tax Revenues
Represents the income that is gained by governments through taxation.
Recession
A phase of short-term economic downturn marked by diminished trade and manufacturing activities, usually recognized by a decrease in GDP for two consecutive quarters.
Automatic Stabilizers
Economic measures and initiatives, like taxation and unemployment insurance, that naturally adapt to mitigate the effects of economic changes without direct action from the government.
Discretionary Fiscal Policy
Changes in government spending and taxes to promote full employment, price stability, and economic growth.
Q9: Refer to Table 7.1.What is the
Q15: Identify the correct statement.<br>A)A monopolist's pricing decision
Q33: Figure 13.1 represents a situation of:<br>A)positive externalities.<br>B)negative
Q40: Refer to Figure 8.4.The profit maximizing level
Q62: According to the information in Scenario 8.2,the
Q63: In general,the two extreme cases of market
Q73: The three phases of antitrust policy in
Q95: Delegates from different countries of the world
Q98: When negative externalities exist in a market,that
Q101: Wal-Mart created a competitive advantage with its