The figures given below represent the revenue curves of a monopolist. Figure 10.2 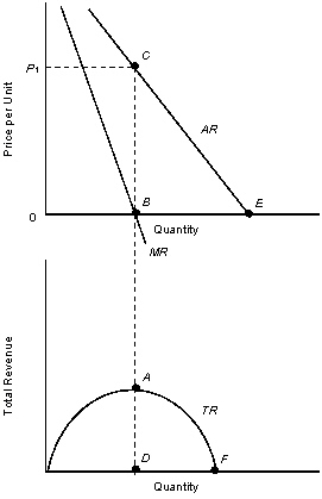
TR: Total revenue curve
AR: Average revenue curve
MR: Marginal revenue curve
-Refer to Figure 10.2.If the monopolist is selling a quantity between B and E,then to maximize total revenue,the monopolist should:
Definitions:
Q10: According to the Coase theorem,high transaction costs
Q10: A deadweight loss arises under perfect competition.
Q14: Under imperfect competition:<br>A)demand curve lies below the
Q16: The objective of creating a brand name
Q18: In the short run,certain costs,such as rent
Q32: Refer to Table 10.4.Assuming that the
Q35: If,at the profit-maximizing level of output,a typical
Q36: When there exists a negative externality in
Q92: Tragedy of commons refers to:<br>A)a problem that
Q120: According to Table 13.1,at the social equilibrium:<br>A)4