The following figure shows the revenue curves of a monopolist: Figure 10.6 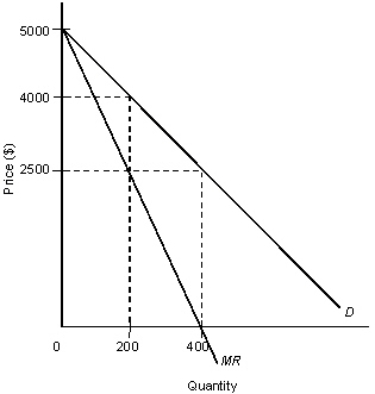
D: Average revenue
MR: Marginal revenue
-In Figure 10.6,assume that marginal costs are constant at $2,500 and fixed costs are zero.What price and output level would result from perfect competition?
Definitions:
Hazard Pay
Hazard Pay is additional compensation provided to employees for performing work that is dangerous or involves risk.
Wealth
The abundance of valuable financial assets or physical possessions which can be converted into forms that can be used for transactions.
Compensating Differential
The difference in wages that arises from differences in the non-monetary aspects of different jobs, such as risk or desirability.
Coding Sector
The industry segment focused on the development, writing, and implementation of computer software and programs.
Q5: The demand curve for a product slopes
Q6: Which of the following is true of
Q16: If a profit-maximizing,perfectly competitive firm is producing
Q26: Marginal revenue of n<sup>th</sup> unit of output
Q38: In the United States,monopoly regulation began primarily
Q53: When economic resources are devoted to transferring
Q71: Because incomes are limited,purchasing one thing means
Q73: The three phases of antitrust policy in
Q90: Consumers are willing to pay a higher
Q90: Refer to Figure 9.3 and calculate the