The figure given below shows the demand curves of two classes of buyers for tickets to a football match. Figure 10.4 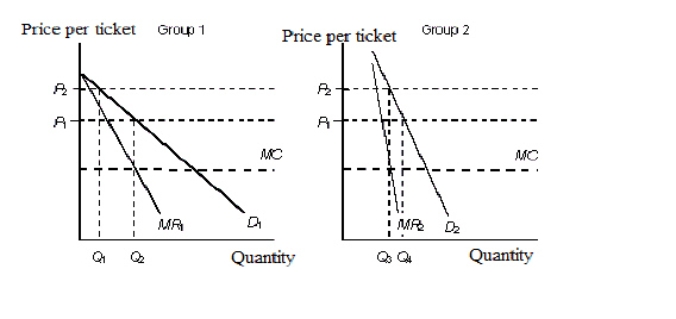
D1: Demand curve of group 1
D2: Demand curve of group 2
MR1: Marginal revenue of group 1
MR2: Marginal revenue of group 2
MC: Marginal cost
-In Figure 10.4,the demand curve D2:
Definitions:
Crowding Out
The phenomenon where increased government spending leads to a reduction in private sector investment, due to higher interest rates or the consumption of financial resources.
Aggregate Demand
The aggregate need for goods and services in an economy at a specific price level and during a certain time frame.
Constitutional Amendment
A formal change or addition proposed to a constitution, which then requires ratification to become part of the document.
Balanced Budget
A financial statement or situation where total expected revenues are equal to total planned expenditures, without any deficit or surplus.
Q14: Economies of scale exist when the long-run
Q27: Refer to Figure 10.5.Which of the following
Q39: When a firm expands in size such
Q46: Firms under perfect competition produce:<br>A)homogeneous products.<br>B)unique products.<br>C)either
Q58: In the long run,total variable cost:<br>A)is equal
Q58: A monopolist's supply curve cannot be derived
Q77: Assume that in Figure 10.5,the market is
Q88: Why do the perfectly competitive firms earn
Q94: The following table shows the marginal productivity
Q97: Under perfect competition,the average revenue curve of