The figure given below shows the demand and cost curves of a perfectly competitive firm. Figure: 9.4 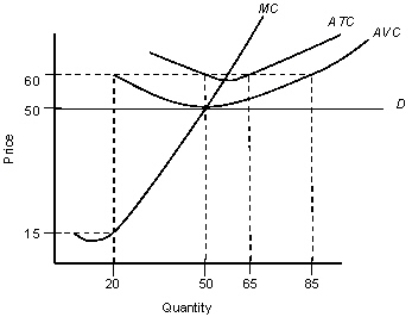
D: Demand curve
MC: Marginal cost curve
ATC: Average-total cost curve
AVC: Average-variable-cost curve
-Refer to Figure 9.4.The presence of the average-variable-cost curve suggests that the firm is operating:
Definitions:
Q7: If at an output of 10 units
Q27: It is often observed that,over the same
Q37: The law of diminishing returns applies:<br>A)in the
Q37: Refer to Table 10.1.At what level of
Q52: Refer to Figure 8.2.At a quantity of
Q59: On August 5,2003,a tragic fire destroyed a
Q69: In Table 8.1,in order to maximize
Q79: Ceteris paribus,a 10 percent increase in income
Q79: In economic theory,we assume that the goal
Q92: The firm will always maximize profit where