Figure 3.3 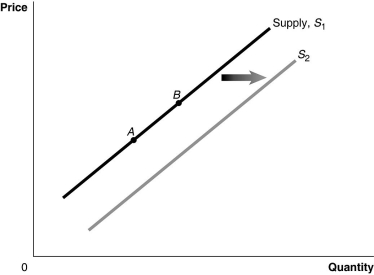 Alt text for Figure 3.3: In figure 3.3, a graph of the effect of an increase in the price of inputs on the supply curve.
Long description for Figure 3.3: The x-axis is labelled, Quantity, and the y-axis is labelled, Price.Curve Supply, S1, is a straight line which slopes up from the bottom left corner to the top right corner.2 points, A and B, are marked in the middle of curve S1.Curve S2 follows the same slope as curve S1, but is plotted to the right.A right pointing arrow indicates the change from curve S1 to curve S2.
-Refer to Figure 3.3.An increase in the number of firms in the market would be represented by a movement from
Definitions:
Disruptive Behavior
Actions that interrupt or disturb normal operations or peace, often causing difficulties in a social or educational environment.
Learning Disorders
Neurologically-based processing problems that interfere with learning basic skills such as reading, writing, or math, as well as higher-level skills including organization, time planning, and abstract reasoning.
Multimodal Approach
A treatment strategy that integrates various therapeutic techniques and methods to address multiple factors of a condition or disorder.
Strategic Tutoring
An approach in tutoring that combines direct teaching of learning strategies with subject matter tutoring.
Q21: Using a broader measure of the unemployment
Q30: George Gnat subscribes to a monthly pest
Q69: Statistics Canada would categorize a retiree who
Q75: Which of the following would shift a
Q83: Refer to Table 4.11.Nominal GDP for Tyrovia
Q106: An increase in quantity supplied is represented
Q164: Someone who is available for work but
Q213: If the quantity of goods and services
Q241: Refer to Figure 3.13.Assume that the graphs
Q258: Refer to Table 4.5.The value added by