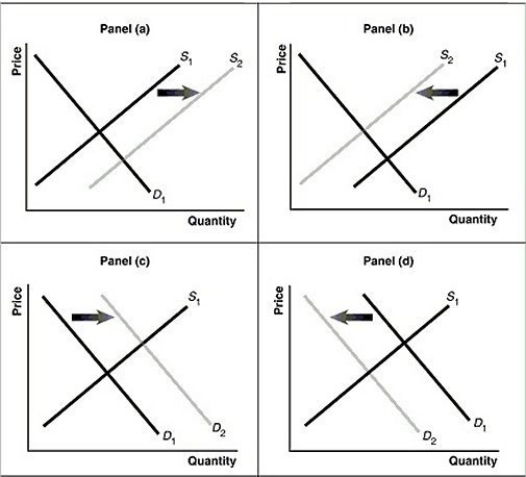
Figure 3.13  Alt text for Figure 3.13a: In figure 3.13a, a graph of intersecting demand and supply curves represents a rising supply of bicycle helmets.
Long description for Figure 3.13a: The x-axis is labelled, Quantity and the y-axis is labelled, as Price.Curve D1 is a straight line which slopes down from the top left corner to the bottom right corner.Curve S1 is a straight line which slopes up from the bottom left to the top right.The point of intersection is at the midpoints of both lines.Curve S2 is a straight line, parallel to curve S1, but plotted to the right.A right pointing arrow indicates the change from S1 to S2.
Alt text for Figure 3.13b: In figure 3.13b, a graph of intersecting demand and supply curves represents a falling supply of bicycle helmets.
Long description for Figure 3.13b: The x-axis is labelled, Quantity and the y-axis is labelled, as Price.Curve D1 is a straight line which slopes down from the top left corner to the bottom right corner.Curve S1 is a straight line which slopes up from the bottom left to the top right.The point of intersection is at the midpoints of both lines.Curve S2 is a straight line, parallel to curve S1, but plotted to the left.A left pointing arrow indicates the change from S1 to S2.
Alt text for Figure 3.13c: In figure 3.13c, a graph of intersecting demand and supply curves represents a rising demand for bicycle helmets.
Long description for Figure 3.13c: The x-axis is labelled, Quantity and the y-axis is labelled, as Price.Curve D1 is a straight line which slopes down from the top left corner to the bottom right corner.Curve S1 is a straight line which slopes up from the bottom left to the top right.The point of intersection is at the midpoints of both lines.Curve D2 is a straight line, parallel to curve D1, but plotted to the right.A right pointing arrow indicates the change from D1 to D2.
Alt text for Figure 3.13d: In figure 3.13d, a graph of intersecting demand and supply curves represents a falling demand for bicycle helmets.
Long description for Figure 3.13d: The x-axis is labelled, Quantity and the y-axis is labelled, as Price.Curve D1 is a straight line which slopes down from the top left corner to the bottom right corner.Curve S1 is a straight line which slopes up from the bottom left to the top right.The point of intersection is at the midpoints of both lines.Curve D2 is a straight line, parallel to curve D1, but plotted to the left.A left pointing arrow indicates the change from D1 to D2.
-Refer to Figure 3.13.Assume that the graphs in this figure represent the demand and supply curves for women's clothing.Which panel best describes what happens in this market when the wages of seamstresses rise?
Definitions:
Elastic Tissue
Connective tissue made of elastin fibers that allow tissues in the body to resume their shape after stretching or contracting.
Loose Connective Tissue
Loose connective tissue is a type of connective tissue characterized by loosely interwoven fibers that provide support and elasticity in various body parts.
Simple Squamous Epithelium
A type of epithelial tissue consisting of a single layer of flat, scale-like cells, involved in functions like diffusion and filtration in various organs.
Brachiocephalic Vein
A major vein formed by the union of the internal jugular and subclavian veins that carries deoxygenated blood to the heart.
Q23: The labour force participation rates of women
Q158: If the population increases and input prices
Q175: Which of the following labour market statistics
Q188: Which of the following headlines would be
Q242: Refer to Table 2.12.Estonia has a comparative
Q245: In December 2015, CHCH TV laid-off 129
Q247: How does Adam Smith's idea of the
Q259: Refer to Figure 3.7.In a free market
Q267: Select the phrase that correctly completes the
Q271: What is the largest component of spending