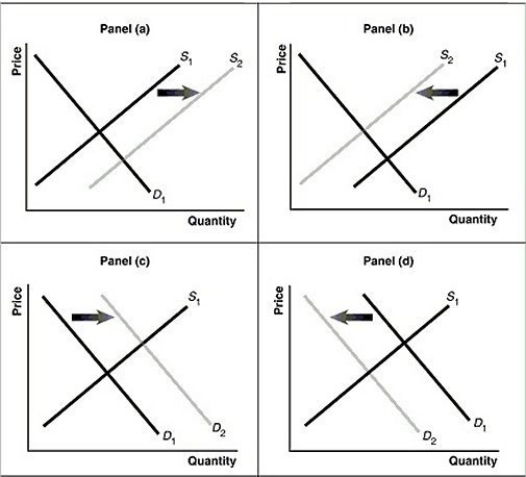
Figure 3.13  Alt text for Figure 3.13a: In figure 3.13a, a graph of intersecting demand and supply curves represents a rising supply of bicycle helmets.
Long description for Figure 3.13a: The x-axis is labelled, Quantity and the y-axis is labelled, as Price.Curve D1 is a straight line which slopes down from the top left corner to the bottom right corner.Curve S1 is a straight line which slopes up from the bottom left to the top right.The point of intersection is at the midpoints of both lines.Curve S2 is a straight line, parallel to curve S1, but plotted to the right.A right pointing arrow indicates the change from S1 to S2.
Alt text for Figure 3.13b: In figure 3.13b, a graph of intersecting demand and supply curves represents a falling supply of bicycle helmets.
Long description for Figure 3.13b: The x-axis is labelled, Quantity and the y-axis is labelled, as Price.Curve D1 is a straight line which slopes down from the top left corner to the bottom right corner.Curve S1 is a straight line which slopes up from the bottom left to the top right.The point of intersection is at the midpoints of both lines.Curve S2 is a straight line, parallel to curve S1, but plotted to the left.A left pointing arrow indicates the change from S1 to S2.
Alt text for Figure 3.13c: In figure 3.13c, a graph of intersecting demand and supply curves represents a rising demand for bicycle helmets.
Long description for Figure 3.13c: The x-axis is labelled, Quantity and the y-axis is labelled, as Price.Curve D1 is a straight line which slopes down from the top left corner to the bottom right corner.Curve S1 is a straight line which slopes up from the bottom left to the top right.The point of intersection is at the midpoints of both lines.Curve D2 is a straight line, parallel to curve D1, but plotted to the right.A right pointing arrow indicates the change from D1 to D2.
Alt text for Figure 3.13d: In figure 3.13d, a graph of intersecting demand and supply curves represents a falling demand for bicycle helmets.
Long description for Figure 3.13d: The x-axis is labelled, Quantity and the y-axis is labelled, as Price.Curve D1 is a straight line which slopes down from the top left corner to the bottom right corner.Curve S1 is a straight line which slopes up from the bottom left to the top right.The point of intersection is at the midpoints of both lines.Curve D2 is a straight line, parallel to curve D1, but plotted to the left.A left pointing arrow indicates the change from D1 to D2.
-Refer to Figure 3.13.Assume that the graphs in this figure represent the demand and supply curves for rice.What happens in this market if buyers expect the price of rice to fall?
Definitions:
Employee Stock Options
A type of compensation given to employees, offering the right to purchase company stock at a specific price within a set period.
Call Options
Financial contracts giving the buyer the right, but not the obligation, to buy a stock, bond, commodity, or other asset at a specified price within a specific time period.
Preferred Stock
A class of ownership in a corporation with a fixed dividend that is paid before any dividends are paid to common stockholders, typically without voting rights.
Common Stock
Shares of ownership in a corporation, giving holders voting rights and a share in the company's profits through dividends, subject to business performance.
Q44: Nominal GDP is another term for<br>A)inflation-adjusted GDP.<br>B)real
Q66: What is the difference between product markets
Q119: Real GDP will increase<br>A)only if the price
Q146: If firms pay what are called "efficiency
Q180: An example of an intermediate good would
Q183: Which of the following is an example
Q194: The underground economy-the informal sector-can be a
Q196: Assume few people can be excellent surgeons
Q213: Even when the demand for one good
Q288: Assume there is a surplus in the