Figure 3.15 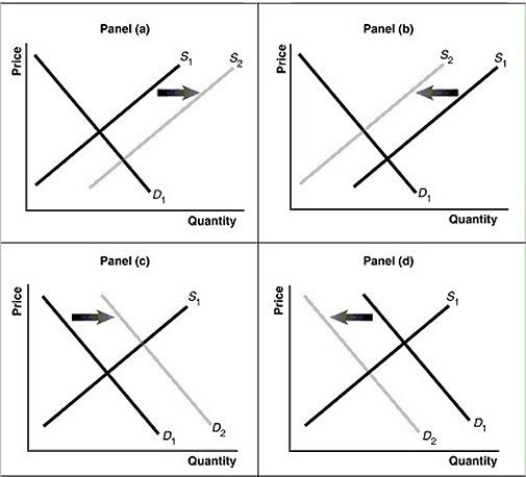 Alt text for Figure 3.15a: In figure 3.15a, a graph of intersecting demand and supply curves represents a rising supply of Blu-ray disc players.
Long description for Figure 3.15a: The x-axis is labelled, Quantity and the y-axis is labelled, as Price.Curve D1 is a straight line which slopes down from the top left corner to the bottom right corner.Curve S1 is a straight line which slopes up from the bottom left to the top right.The point of intersection is at the midpoints of both lines.Curve S2 is a straight line, parallel to curve S1, but plotted to the right.A right pointing arrow indicates the change from S1 to S2.
Alt text for Figure 3.15b: In figure 3.15b, a graph of intersecting demand and supply curves represents a falling supply of Blu-ray players.
Long description for Figure 3.15b: The x-axis is labelled, Quantity and the y-axis is labelled, as Price.Curve D1 is a straight line which slopes down from the top left corner to the bottom right corner.Curve S1 is a straight line which slopes up from the bottom left to the top right.The point of intersection is at the midpoints of both lines.Curve S2 is a straight line, parallel to curve S1, but plotted to the left.A left pointing arrow indicates the change from S1 to S2.
Alt text for Figure 3.15c: In figure 3.15c, a graph of intersecting demand and supply curves represents a rising demand for Blu-ray players.
Long description for Figure 3.15c: The x-axis is labelled, Quantity and the y-axis is labelled, as Price.Curve D1 is a straight line which slopes down from the top left corner to the bottom right corner.Curve S1 is a straight line which slopes up from the bottom left to the top right.The point of intersection is at the midpoints of both lines.Curve D2 is a straight line, parallel to curve D1, but plotted to the right.A right pointing arrow indicates the change from D1 to D2.
Alt text for Figure 3.15d: In figure 3.15d, a graph of intersecting demand and supply curves represents a falling demand for Blu-ray disc players.
Long description for Figure 3.15d: The x-axis is labelled, Quantity and the y-axis is labelled, as Price.Curve D1 is a straight line which slopes down from the top left corner to the bottom right corner.Curve S1 is a straight line which slopes up from the bottom left to the top right.The point of intersection is at the midpoints of both lines.Curve D2 is a straight line, parallel to curve D1, but plotted to the left.A left pointing arrow indicates the change from D1 to D2.
-Refer to Figure 3.15.Assume that the graphs in this figure represent the demand and supply curves for tuna.Which panel best describes what happens in this market when there is a decrease in the productivity of commercial fishermen?
Definitions:
Q16: Refer to Figure 3.4.An increase in the
Q17: The phrase "demand has increased" means that<br>A)a
Q20: In Canada, household spending on consumption as
Q45: Statistics Canada would categorize a person as
Q66: Refer to Table 5.1.The unemployment rate for
Q144: _ behavioural assumption about humans was that
Q153: Cyclical unemployment is the result of<br>A)a persistent
Q165: Which of the following describes the relationship
Q207: In recent years the cost of producing
Q298: Following the successful launch of Red Bull