Figure 3.15 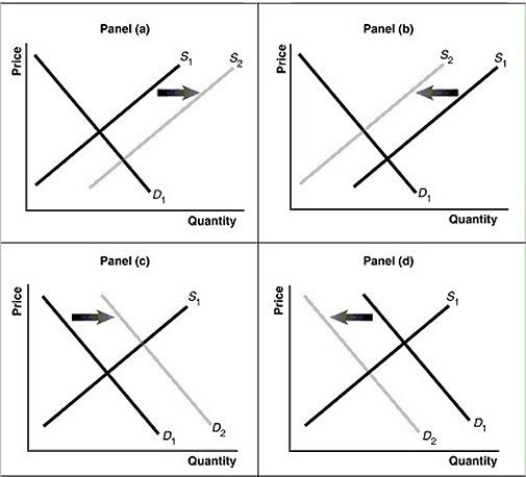 Alt text for Figure 3.15a: In figure 3.15a, a graph of intersecting demand and supply curves represents a rising supply of Blu-ray disc players.
Long description for Figure 3.15a: The x-axis is labelled, Quantity and the y-axis is labelled, as Price.Curve D1 is a straight line which slopes down from the top left corner to the bottom right corner.Curve S1 is a straight line which slopes up from the bottom left to the top right.The point of intersection is at the midpoints of both lines.Curve S2 is a straight line, parallel to curve S1, but plotted to the right.A right pointing arrow indicates the change from S1 to S2.
Alt text for Figure 3.15b: In figure 3.15b, a graph of intersecting demand and supply curves represents a falling supply of Blu-ray players.
Long description for Figure 3.15b: The x-axis is labelled, Quantity and the y-axis is labelled, as Price.Curve D1 is a straight line which slopes down from the top left corner to the bottom right corner.Curve S1 is a straight line which slopes up from the bottom left to the top right.The point of intersection is at the midpoints of both lines.Curve S2 is a straight line, parallel to curve S1, but plotted to the left.A left pointing arrow indicates the change from S1 to S2.
Alt text for Figure 3.15c: In figure 3.15c, a graph of intersecting demand and supply curves represents a rising demand for Blu-ray players.
Long description for Figure 3.15c: The x-axis is labelled, Quantity and the y-axis is labelled, as Price.Curve D1 is a straight line which slopes down from the top left corner to the bottom right corner.Curve S1 is a straight line which slopes up from the bottom left to the top right.The point of intersection is at the midpoints of both lines.Curve D2 is a straight line, parallel to curve D1, but plotted to the right.A right pointing arrow indicates the change from D1 to D2.
Alt text for Figure 3.15d: In figure 3.15d, a graph of intersecting demand and supply curves represents a falling demand for Blu-ray disc players.
Long description for Figure 3.15d: The x-axis is labelled, Quantity and the y-axis is labelled, as Price.Curve D1 is a straight line which slopes down from the top left corner to the bottom right corner.Curve S1 is a straight line which slopes up from the bottom left to the top right.The point of intersection is at the midpoints of both lines.Curve D2 is a straight line, parallel to curve D1, but plotted to the left.A left pointing arrow indicates the change from D1 to D2.
-Refer to Figure 3.15.Assume that the graphs in this figure represent the demand and supply curves for mustard and that bratwurst and mustard are complements.Which panel describes what happens in this market when the price of bratwurst falls?
Definitions:
Profit
The financial gain obtained when the revenue from selling goods or services exceeds the total cost of producing them.
Fixed Costs
Costs that remain constant regardless of a business's operational levels, including rent, salaries, and loan repayments.
Break-Even Point
The point at which total costs and total revenues are equal, resulting in no gain or loss for the business.
Fixed Costs
Overhead expenses that do not vary with production level or sales volume, such as rent, salaries, and insurance.
Q41: In September 2016, the government of Alberta
Q111: If real GDP is larger than nominal
Q134: Refer to Figure 3.15.Assume that the graphs
Q174: Which of the following statements about an
Q203: An increase in the unemployment rate may
Q216: If, in response to an increase in
Q258: If, for a product, the quantity supplied
Q276: In the circular flow model, households<br>A)sell goods
Q282: Suppose that when the price of hamburgers
Q284: Refer to Figure 3.16.The graph in this