Figure 3.16 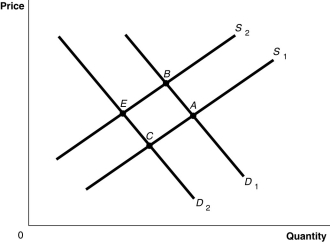 Alt text for Figure 3.16: In figure 3.16, a graph plotting intersecting demand and supply curves represents the change in equilibrium point in the motorcycle market with the increase in price of engines and wages of motorcycle manufacturers.
Long description for Figure 3.16: The x-axis is labelled, Quantity and the y-axis is labelled, Price.Curve D1 is a straight line which slopes down from the top left corner to the bottom right corner.Curve D2 is parallel with curve D1, but is plotted to the left.Curve S1 is a straight line which slopes up from the bottom right corner to the top left corner.Curve S2 is parallel to curve S1, but is plotted to the left.The 4 curves intersect at 4 points; A, B, on the right side of the lines, and C and D, on the left sides of the lines
-Refer to Figure 3.16.The graph in this figure illustrates an initial competitive equilibrium in the market for motorcycles at the intersection of D1 and S1 (point
Definitions:
Dependent Trials
Experiments or trials in which the outcome or result of one affects the outcome or result of another.
Discrete Probability
The probability of occurrence of outcomes in a dataset that consists of distinct, separate values.
Required Condition
A necessary state or circumstance that must be met for something to occur or be considered true.
Probability Function
A function that associates a probability with each outcome in the sample space of a stochastic experiment.
Q16: Refer to Figure 3.4.An increase in the
Q45: Assume that both the demand curve and
Q45: If real GDP in 2017 (using 2007
Q56: Refer to Table 4.6.Suppose that a simple
Q67: For each of the following pairs of
Q73: Refer to Figure 2.14.What is the opportunity
Q100: The circular flow of income shows that
Q133: Refer to Figure 3.13.Assume that the graphs
Q180: Studies have shown that drinking one glass
Q208: The _ effect refers to the change