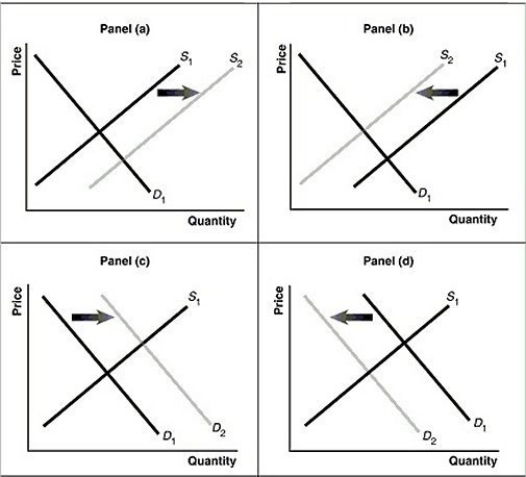
Figure 3.13  Alt text for Figure 3.13a: In figure 3.13a, a graph of intersecting demand and supply curves represents a rising supply of bicycle helmets.
Long description for Figure 3.13a: The x-axis is labelled, Quantity and the y-axis is labelled, as Price.Curve D1 is a straight line which slopes down from the top left corner to the bottom right corner.Curve S1 is a straight line which slopes up from the bottom left to the top right.The point of intersection is at the midpoints of both lines.Curve S2 is a straight line, parallel to curve S1, but plotted to the right.A right pointing arrow indicates the change from S1 to S2.
Alt text for Figure 3.13b: In figure 3.13b, a graph of intersecting demand and supply curves represents a falling supply of bicycle helmets.
Long description for Figure 3.13b: The x-axis is labelled, Quantity and the y-axis is labelled, as Price.Curve D1 is a straight line which slopes down from the top left corner to the bottom right corner.Curve S1 is a straight line which slopes up from the bottom left to the top right.The point of intersection is at the midpoints of both lines.Curve S2 is a straight line, parallel to curve S1, but plotted to the left.A left pointing arrow indicates the change from S1 to S2.
Alt text for Figure 3.13c: In figure 3.13c, a graph of intersecting demand and supply curves represents a rising demand for bicycle helmets.
Long description for Figure 3.13c: The x-axis is labelled, Quantity and the y-axis is labelled, as Price.Curve D1 is a straight line which slopes down from the top left corner to the bottom right corner.Curve S1 is a straight line which slopes up from the bottom left to the top right.The point of intersection is at the midpoints of both lines.Curve D2 is a straight line, parallel to curve D1, but plotted to the right.A right pointing arrow indicates the change from D1 to D2.
Alt text for Figure 3.13d: In figure 3.13d, a graph of intersecting demand and supply curves represents a falling demand for bicycle helmets.
Long description for Figure 3.13d: The x-axis is labelled, Quantity and the y-axis is labelled, as Price.Curve D1 is a straight line which slopes down from the top left corner to the bottom right corner.Curve S1 is a straight line which slopes up from the bottom left to the top right.The point of intersection is at the midpoints of both lines.Curve D2 is a straight line, parallel to curve D1, but plotted to the left.A left pointing arrow indicates the change from D1 to D2.
-Refer to Figure 3.13.Assume that the graphs in this figure represent the demand and supply curves for rice.What happens in this market if buyers expect the price of rice to fall?
Definitions:
Expert Systems
Artificial intelligence programs that use expert-level knowledge to solve problems in a specific domain, mimicking the decision-making ability of a human expert.
Automated Sensors
Devices that operate autonomously to collect data or detect specific conditions, often used in industrial and home applications.
Simulation
The attempt to duplicate the features, appearance, and characteristics of a real system, usually via a computerized model.
Failure Rate
The rate at which a designed system or part malfunctions, measured in failures over a specific time period.
Q72: Canadian GDP shrank in the first half
Q74: Sarah is a full-time student who is
Q120: Refer to Table 4.13.Nominal GDP for Vicuna
Q126: Crude oil is not an example of
Q129: If the number employed is 17.5 million,
Q144: _ behavioural assumption about humans was that
Q150: Refer to Figure 2.14.What is the opportunity
Q154: Refer to Figure 2.8.The linear production possibilities
Q160: Refer to Table 4.4.Consider the data above
Q161: Suppose that when the price of hamburgers