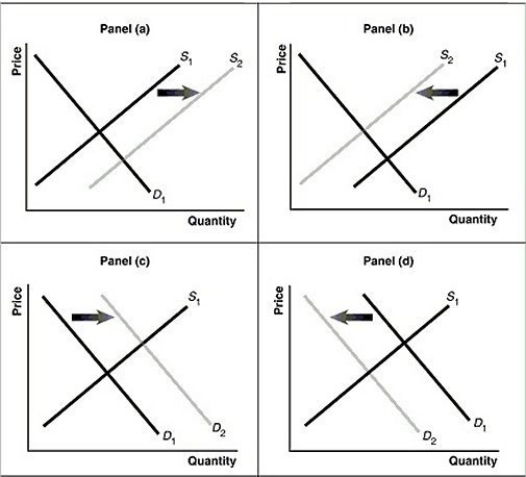
Figure 3.13  Alt text for Figure 3.13a: In figure 3.13a, a graph of intersecting demand and supply curves represents a rising supply of bicycle helmets.
Long description for Figure 3.13a: The x-axis is labelled, Quantity and the y-axis is labelled, as Price.Curve D1 is a straight line which slopes down from the top left corner to the bottom right corner.Curve S1 is a straight line which slopes up from the bottom left to the top right.The point of intersection is at the midpoints of both lines.Curve S2 is a straight line, parallel to curve S1, but plotted to the right.A right pointing arrow indicates the change from S1 to S2.
Alt text for Figure 3.13b: In figure 3.13b, a graph of intersecting demand and supply curves represents a falling supply of bicycle helmets.
Long description for Figure 3.13b: The x-axis is labelled, Quantity and the y-axis is labelled, as Price.Curve D1 is a straight line which slopes down from the top left corner to the bottom right corner.Curve S1 is a straight line which slopes up from the bottom left to the top right.The point of intersection is at the midpoints of both lines.Curve S2 is a straight line, parallel to curve S1, but plotted to the left.A left pointing arrow indicates the change from S1 to S2.
Alt text for Figure 3.13c: In figure 3.13c, a graph of intersecting demand and supply curves represents a rising demand for bicycle helmets.
Long description for Figure 3.13c: The x-axis is labelled, Quantity and the y-axis is labelled, as Price.Curve D1 is a straight line which slopes down from the top left corner to the bottom right corner.Curve S1 is a straight line which slopes up from the bottom left to the top right.The point of intersection is at the midpoints of both lines.Curve D2 is a straight line, parallel to curve D1, but plotted to the right.A right pointing arrow indicates the change from D1 to D2.
Alt text for Figure 3.13d: In figure 3.13d, a graph of intersecting demand and supply curves represents a falling demand for bicycle helmets.
Long description for Figure 3.13d: The x-axis is labelled, Quantity and the y-axis is labelled, as Price.Curve D1 is a straight line which slopes down from the top left corner to the bottom right corner.Curve S1 is a straight line which slopes up from the bottom left to the top right.The point of intersection is at the midpoints of both lines.Curve D2 is a straight line, parallel to curve D1, but plotted to the left.A left pointing arrow indicates the change from D1 to D2.
-Refer to Figure 3.13.Assume that the graphs in this figure represent the demand and supply curves for bicycle helmets.Which panel best describes what happens in this market if there is a substantial increase in the price of bicycles?
Definitions:
Lower-Than-Market Rent
Rental rates offered at a price below the current market average, often used as an incentive or for strategic reasons.
Process Layout
A way to arrange a manufacturing business by placing all comparable equipment together in the same area.
Manufacturing Business
A company involved in the transformation of raw materials into finished products through the use of machinery and labor.
Free-Flow Layout
A store or workplace arrangement where fixtures and merchandise are grouped in an informal, non-linear manner to encourage exploration by customers.
Q24: The Employment Insurance program has which of
Q69: Increases in real GDP would overstate the
Q113: During the 1990s, positive technological change in
Q123: The basis for trade is absolute advantage,
Q176: The size of the underground economy would
Q185: The underground economy can be described as<br>A)production
Q211: In 2016, Canadian wheat and barley crops
Q245: In December 2015, CHCH TV laid-off 129
Q259: Refer to Figure 3.7.In a free market
Q273: If a country produces only two goods,