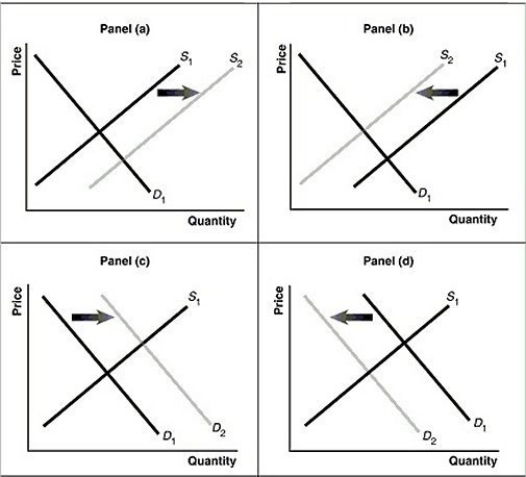
Figure 3.13  Alt text for Figure 3.13a: In figure 3.13a, a graph of intersecting demand and supply curves represents a rising supply of bicycle helmets.
Long description for Figure 3.13a: The x-axis is labelled, Quantity and the y-axis is labelled, as Price.Curve D1 is a straight line which slopes down from the top left corner to the bottom right corner.Curve S1 is a straight line which slopes up from the bottom left to the top right.The point of intersection is at the midpoints of both lines.Curve S2 is a straight line, parallel to curve S1, but plotted to the right.A right pointing arrow indicates the change from S1 to S2.
Alt text for Figure 3.13b: In figure 3.13b, a graph of intersecting demand and supply curves represents a falling supply of bicycle helmets.
Long description for Figure 3.13b: The x-axis is labelled, Quantity and the y-axis is labelled, as Price.Curve D1 is a straight line which slopes down from the top left corner to the bottom right corner.Curve S1 is a straight line which slopes up from the bottom left to the top right.The point of intersection is at the midpoints of both lines.Curve S2 is a straight line, parallel to curve S1, but plotted to the left.A left pointing arrow indicates the change from S1 to S2.
Alt text for Figure 3.13c: In figure 3.13c, a graph of intersecting demand and supply curves represents a rising demand for bicycle helmets.
Long description for Figure 3.13c: The x-axis is labelled, Quantity and the y-axis is labelled, as Price.Curve D1 is a straight line which slopes down from the top left corner to the bottom right corner.Curve S1 is a straight line which slopes up from the bottom left to the top right.The point of intersection is at the midpoints of both lines.Curve D2 is a straight line, parallel to curve D1, but plotted to the right.A right pointing arrow indicates the change from D1 to D2.
Alt text for Figure 3.13d: In figure 3.13d, a graph of intersecting demand and supply curves represents a falling demand for bicycle helmets.
Long description for Figure 3.13d: The x-axis is labelled, Quantity and the y-axis is labelled, as Price.Curve D1 is a straight line which slopes down from the top left corner to the bottom right corner.Curve S1 is a straight line which slopes up from the bottom left to the top right.The point of intersection is at the midpoints of both lines.Curve D2 is a straight line, parallel to curve D1, but plotted to the left.A left pointing arrow indicates the change from D1 to D2.
-Refer to Figure 3.13.Assume that the graphs in this figure represent the demand and supply curves for almonds.Which panel best describes what happens in this market when there is an increase in the productivity of almond harvesters?
Definitions:
American Market Economy
An economic system where decisions regarding investment, production, and distribution are based on supply and demand, with minimal government intervention.
Government Planning
The process by which a government sets priorities, establishes goals, and devises strategies to achieve economic, social, and political objectives.
Voluntary Actions
Behaviors or actions undertaken by choice or will without external coercion.
Civil Society
The realm of organized social life that is voluntary, not-for-profit, and outside of the government, which can include NGOs, clubs, and other nonprofit entities.
Q20: In Canada, household spending on consumption as
Q33: Which of the following would cause an
Q123: Refer to Figure 3.15.Assume that the graphs
Q157: If pilots and flight attendants agree to
Q163: The idea underlying Adam Smith's "invisible hand"
Q175: Governments do not face trade-offs in providing
Q183: The GDP deflator is equal to<br>A)real GDP
Q218: Refer to Figure 2.5.If the economy is
Q278: In recent years the cost of producing
Q281: If the price of a good or