Figure 5.1 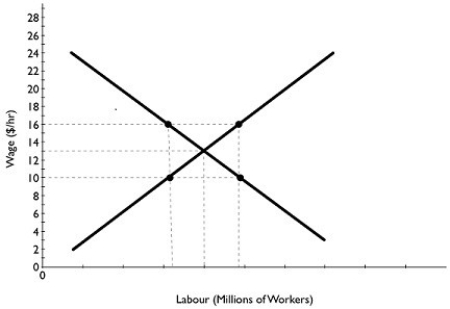 Alt text for Figure 5.1: In figure 5.1, a graph of the labour market.
Long description for Figure 5.1: The x-axis is labelled, labour (millions of workers) .The y-axis is labelled, wage (dollars per hour) , ranging from 0 to 28 in increments of 2.2 intersecting lines are shown.A line slopes down from the top left of the quadrant, near the value 24 on the y-axis, to the bottom right corner, near the end of the x-axis.A second line slopes up from the bottom left corner of the quadrant, near the origin, to the top right corner.4 points plotted along the 2 sloping lines, and the point of intersection of the 2 lines, are connected to the corresponding values on the x-axis, and to the values 10, 13 and 16 on the y-axis.
-Refer to Figure 5.1.Based on the graph of the labour market above, if a minimum wage of $16 per hour is imposed, which of the following will result?
Definitions:
Aggregate Production
The total output of goods and services produced by an economy over a specified period.
Aggregate Production
The total output of goods and services produced by an economy over a given period.
Aggregate Purchases
The total amount spent on goods and services within an economy at a given period of time.
Unintended Inventory Investment
Occurs when a business accumulates inventory beyond its planned level, often due to lower than expected sales.
Q59: The "underground economy" refers to<br>A)the buying and
Q93: Why might firms pay wages that are
Q133: What are menu costs?<br>A)the full list of
Q138: Refer to Table 5.2.Assume the market basket
Q159: Refer to Figure 6.5."Crowding out" of firm
Q199: All else equal, an increase in the
Q200: Knowledge capital is nonrival in the sense
Q243: Cashmere socks cost 35 cents a pair
Q246: The costs to firms of changing prices
Q275: If inflationary expectations are increasing, we would