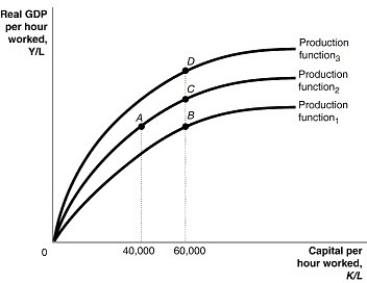
Figure 7.1  Alt text for Figure 7.1: In figure 7.1, a graph comparing capital per hour worked and real GDP per hour worked.
Long description for Figure 7.1: The x-axis is labelled, capital per hour worked, K/L, with values 40,000 and 60,000 marked.The y-axis is labelled, real GDP per hour worked, Y/L, with 0 at the vertex.3 concave curves, each originating from the vertex are shown.4 points A, B, C, and D are plotted such that point A has 40,000 as the x coordinate, and points B, C, and D have 60,000 as the x coordinate.The 3 curves pass through these points.The curve labelled, Production function 1, passes through point B.The curve labelled, Production function 2, passes through points A and C.The curve labelled, Production function 3, passes through point D.
-Refer to Figure 7.1.Within a country, the impact of wars and revolutions and their subsequent destruction of capital is reflected in the per-worker production function in the figure above by a movement from
Definitions:
Industry
A sector of the economy that produces goods or services, often classified into primary, secondary, and tertiary sectors.
Firms
Businesses or organizations that produce goods or provide services, typically with the objective of making a profit.
Industry
A category of economic activity related to the production of goods, provision of services, or extraction of resources.
Cutthroat Competition
A market situation characterized by aggressive competition, where companies compete intensely, often at the expense of profit margins.
Q36: Entrepreneurship in Mexico is<br>A)still risky due to
Q103: Which of the following describes a situation
Q109: If the federal government regulated airline ticket
Q114: An increase in aggregate expenditure has what
Q123: Which of the following accurately describes the
Q131: The formula for aggregate expenditure is<br>A)AE =
Q158: Recent rapid economic growth in India and
Q160: How have government policies and programs affected
Q221: Explain why a centrally-planned economy might not
Q283: The decline in consumer spending during the