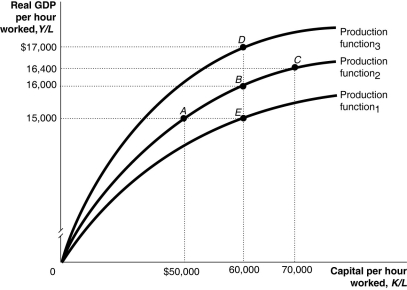
Figure 7.4  Alt text for Figure 7.4: In figure 7.4, a graph representing per-worker production functions.
Long description for Figure 7.4: The x-axis is labelled, capital per hour worked, K/L.The y-axis is labelled, real GDP per hour worked, Y/L.3 concave curves originating from 0 at the vertex are shown.5 points A ($50000, $15000) , B ($60000, $16000) , C ($70000, $16400) , D ($60000, $17000) , and E ($60000, $15000) are plotted.The curve labelled, Production function 1, passes through point E.The curve labelled, Production function 2, passes through points A, B, and C.The curve labelled, Production function 3, passes through point D.These 5 points are connected to their respective coordinates on the x-axis and y-axis with dotted lines.
-Refer to Figure 7.4.Which of the following combinations of points illustrates changes in the Soviet Union's economy from 1950 to 1980?
Definitions:
Utility Function
A mathematical representation of how consumers rank different bundles of goods according to their level of satisfaction or utility.
Wealth
The presence of significant financial assets or tangible property that can be transformed into a medium suitable for trade.
Pain Of Losing
The emotional or psychological distress experienced after suffering a loss, often more intense than the joy of equivalent gains.
Firm-Specific Risk
Firm-specific risk refers to the risk associated with events or factors that are unique to a particular company, which can affect its stock price.
Q71: Refer to Figure 9.1.Ceteris paribus, an increase
Q80: If there is a change in the
Q96: Since 1980, recessions in Canada<br>A)have not occurred.<br>B)have
Q161: If, between 2010 and 2020, the economy's
Q214: Planned aggregate expenditure is equal to<br>A)consumption spending
Q222: Which of the following is one explanation
Q235: The owner of a firm wants some
Q243: How do government policies that enforce property
Q260: Inflation usually increases during a recession and
Q300: Which is the smallest component of aggregate