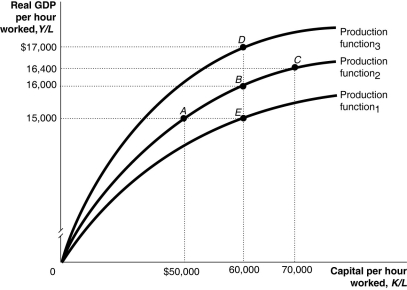
Figure 7.4  Alt text for Figure 7.4: In figure 7.4, a graph representing per-worker production functions.
Long description for Figure 7.4: The x-axis is labelled, capital per hour worked, K/L.The y-axis is labelled, real GDP per hour worked, Y/L.3 concave curves originating from 0 at the vertex are shown.5 points A ($50000, $15000) , B ($60000, $16000) , C ($70000, $16400) , D ($60000, $17000) , and E ($60000, $15000) are plotted.The curve labelled, Production function 1, passes through point E.The curve labelled, Production function 2, passes through points A, B, and C.The curve labelled, Production function 3, passes through point D.These 5 points are connected to their respective coordinates on the x-axis and y-axis with dotted lines.
-Refer to Figure 7.4.Using the per-worker production function in the figure above, the largest changes in an economy's standard of living would be achieved by a movement from
Definitions:
Devil's Advocate
Someone who, for the sake of argument, adopts a position they do not necessarily agree with, in order to debate or explore the idea further.
Career Advice
Guidance or recommendations regarding professional development and strategies for career growth.
Mental Rehearses
The process of mentally practicing a task or envisioning a situation, often used as a technique to improve performance or prepare for specific scenarios.
Track Record
The accumulated history or performance data of an individual or entity, often indicating success or reliability over time.
Q10: What does the PPI measure?<br>A)the average change
Q28: The _ shows the relationship between the
Q34: The marginal propensity to consume is defined
Q169: Countries without well-developed financial systems are able
Q170: The U.S.economy has seen a faster increase
Q221: Explain why a centrally-planned economy might not
Q227: When production in an economy grows more
Q231: Between 2014 and 2015, the CPI of
Q262: Consider two countries, Alpha and Beta.In Alpha,
Q312: If the consumption function is defined as