Figure 7.2 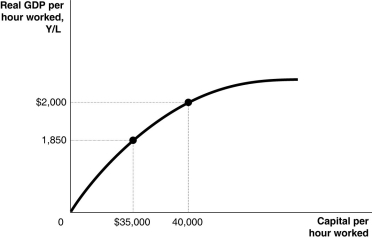 Alt text for Figure 7.2: In figure 7.2, a graph comparing capital per hour worked and real GDP per hour worked.
Long description for Figure 7.2: The x-axis is labelled, capital per hour worked.The y-axis is labelled, real GDP per hour worked, Y/L.A concave curve originates from 0 at the vertex and passes through 2 points ($35,000, 1,850) and (40,000, $2000) , toward the end of the x-axis.These 2 points are connected to their respective coordinates on the x-axis and y-axis with dotted lines.
-Refer to Figure 7.2.Based on the per-worker production function above, if the Canadian economy raises capital per hour worked from $35,000 to $40,000, by how much will real GDP per hour worked increase?
Definitions:
Allowance
A reduction from the gross amount of an asset to recognize a reduction in its value.
Bad Debt Expense
An expense reported on the income statement, representing the estimated amount of receivables that a company does not expect to collect.
Receivable
Money owed to a company by its customers or other parties for goods or services that have been delivered or used but not yet paid for.
Year of Sale
The specific calendar year in which a sale transaction of goods, services, or assets is completed.
Q24: Globalization is positively associated with<br>A)poverty.<br>B)declining rates of
Q24: What is "human capital," and how does
Q38: Using equations for public and private saving,
Q82: Macroeconomic equilibrium can occur at any point
Q122: Consumption spending is $5 million, planned investment
Q134: Economists first began studying the relationship between
Q218: Refer to Figure 8.7.Suppose that investment spending
Q241: What impact does a lower price level
Q277: Knowledge capital is<br>A)rival.<br>B)nonrival.<br>C)nonexcludable.<br>D)both B and C
Q282: There are no costs to inflation if