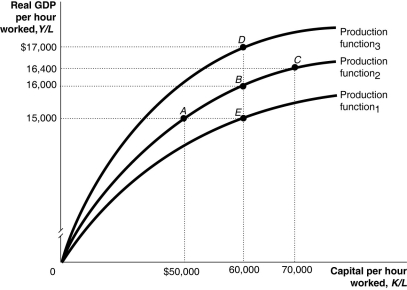
Figure 7.4  Alt text for Figure 7.4: In figure 7.4, a graph representing per-worker production functions.
Long description for Figure 7.4: The x-axis is labelled, capital per hour worked, K/L.The y-axis is labelled, real GDP per hour worked, Y/L.3 concave curves originating from 0 at the vertex are shown.5 points A ($50000, $15000) , B ($60000, $16000) , C ($70000, $16400) , D ($60000, $17000) , and E ($60000, $15000) are plotted.The curve labelled, Production function 1, passes through point E.The curve labelled, Production function 2, passes through points A, B, and C.The curve labelled, Production function 3, passes through point D.These 5 points are connected to their respective coordinates on the x-axis and y-axis with dotted lines.
-Refer to Figure 7.4.Suppose the per-worker production function in the figure above represents the production function for the Canadian economy.If Canada decided to cut its support of university research in half, this would cause a movement from
Definitions:
Q20: When we graph consumption as a function
Q26: How do lower income taxes affect aggregate
Q26: Some researchers have been unable to find
Q113: Foreign direct investment occurs when a Chinese
Q137: Refer to Figure 7.4.Suppose the per-worker production
Q187: Which of the following is not a
Q206: An increase in the price level in
Q216: If inflation is higher than expected, this
Q254: Refer to Figure 8.1.At point L in
Q279: The period of time from 1 000