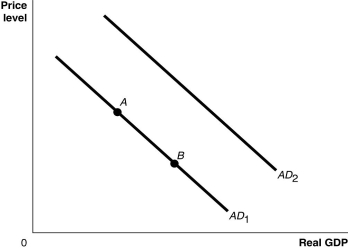
Figure 9.1  Alt text for Figure 9.1: In figure 9.1, a graph comparing real GDP and price level.
Long description for Figure 9.1: The x-axis is labelled, real GDP, and the y-axis is labelled, price level, with 0 at the vertex.Line AD1 begins in the top left corner and slopes down to the bottom center.Line AD2 follows the same slope as line AD1 but is plotted to the right.Points A and B are plotted along line AD1.Point A is a little less than half way along the left side of the line, and point B is little more than half way on the right side of the line.
-Refer to Figure 9.1.Ceteris paribus, a decrease in firms' expectations of the future profitability of investment spending would be represented by a movement from
Definitions:
Mathematical Model
A representation of a system, process, or relationship in mathematical form, using symbols and equations.
Operating Characteristics
Key features and parameters that describe how a system performs under various conditions, often used in evaluating process efficiency.
Action Decisions
Decisions that lead to specific actions aimed at achieving objectives or solving problems within an organization or project.
Q5: If planned aggregate expenditure is above potential
Q10: Which of the following is not a
Q20: When we graph consumption as a function
Q40: All of the following would be considered
Q79: The long-run aggregate supply curve will shift
Q96: If you transfer all of your currency
Q192: What impact does a higher price level
Q218: Refer to Figure 8.7.Suppose that investment spending
Q299: Refer to Figure 8.3.If the economy is
Q305: Consumption spending is $5 million, planned investment