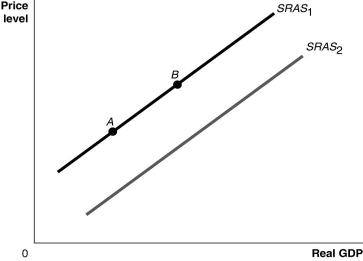
Figure 9.3  Alt text for Figure 9.3: In figure 9.3, a graph comparing real GDP and price level.
Long description for Figure 9.3: The x-axis is labelled, real GDP, with 0 at the vertex, and the y-axis is labelled, price level.2 lines are shown; SRAS1 and SRAS2.Line SRAS1 begins a little above the vertex and slopes up to the top right corner.Line SRAS2 follows the same slope as line SRAS1, but is plotted to the right.Points A and B are plotted on line SRAS1.Point A is near the left end of the line and point B is near the center of the line.
-Refer to Figure 9.3.Ceteris paribus, an increase in productivity would be represented by a movement from
Definitions:
Money Supply
This refers to the total amount of money (including cash, coins, and balances in bank accounts) in circulation within an economy at a given time.
Economic Behaviorists
Economic Behaviorists study how psychological, social, cognitive, and emotional factors affect economic decisions of individuals and institutions, and the consequences these decisions have on market prices, returns, and the allocation of resources.
Rational Behavior
Rational behavior refers to the decision-making process that involves choosing the most efficient means to achieve a desired result.
Economic Self-interest
The driving force behind the actions of individuals that encourages them to fulfill their needs and desires.
Q21: Monetary policy refers to the actions the<br>A)Prime
Q43: When the Bank of Canada decreases the
Q45: Refer to Scenario 10.1.M2+ in this simple
Q107: Maintaining a strong dollar in international currency
Q129: A rising price level decreases consumption by
Q159: At a short-run macroeconomic equilibrium, real GDP
Q188: Inflation rates during the years 1979-1981 were
Q241: One potential problem with the Chinese government's
Q266: If planned aggregate expenditure is below potential
Q283: The decline in consumer spending during the