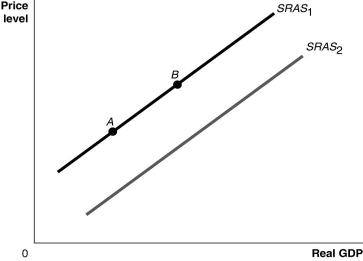
Figure 9.3  Alt text for Figure 9.3: In figure 9.3, a graph comparing real GDP and price level.
Long description for Figure 9.3: The x-axis is labelled, real GDP, with 0 at the vertex, and the y-axis is labelled, price level.2 lines are shown; SRAS1 and SRAS2.Line SRAS1 begins a little above the vertex and slopes up to the top right corner.Line SRAS2 follows the same slope as line SRAS1, but is plotted to the right.Points A and B are plotted on line SRAS1.Point A is near the left end of the line and point B is near the center of the line.
-Refer to Figure 9.3.Ceteris paribus, an increase in productivity would be represented by a movement from
Definitions:
Antifeminist Leaders
Individuals or figures who oppose feminism and the advocacy for women's rights and equality between the sexes.
Military Draft
A system for compulsory recruitment of individuals into the military services, where citizens are called to serve based on eligibility criteria.
Native American Rights Fund
A legal organization established in 1970 to defend and advance the rights of Native American tribes, communities, and individuals.
Tribal Ownership
The collective ownership of land, resources, or entities by indigenous tribes or groups, often governed by tribal laws and customs.
Q18: The Bank of Canada's two main monetary
Q21: Which of the following is an appropriate
Q38: When the price of oil rises unexpectedly,
Q86: Household spending on goods and services is
Q105: Gold is an example of<br>A)commodity money.<br>B)fiat money.<br>C)barter
Q160: As a result of the oil price,
Q236: Explain how the economy moves back to
Q238: Stagflation occurs when aggregate supply and aggregate
Q267: Refer to Figure 11.3.In the figure above,
Q295: The marginal propensity to save is defined