Figure 12.4 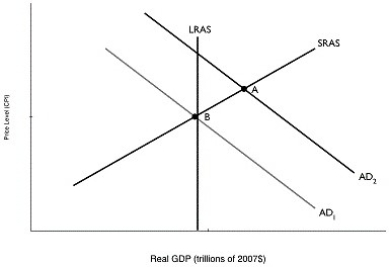 Alt text for Figure 12.4: In figure 12.4, a graph comparing real GDP and price level.
Long description for Figure 12.4: The x-axis is labelled, real GDP (trillions of 2007 dollars) and the y-axis is labelled, price level (CPI) .4 lines are shown; AD1, AD2, LRAS, and SRAS.Line AD1 begins at the top left corner and slopes down to the end of the x-axis.Line AD2 follows the same slope as line A1, but is plotted to the right.Line SRAS begins in the bottom left corner and slopes up to the top right corner.Line LRAS is perpendicular to the x-axis, and intersects lines AD1 and SRAS at point B.Lines AD2 and SRAS intersect at point A.
-Refer to Figure 12.4.In the graph above, suppose the economy is initially at point A.The movement of the economy to point B as shown in the graph illustrates the effect of which of the following policy actions by the federal government?
Definitions:
Union Shop
A workplace where employees must join the union within a certain timeframe after being hired.
Lockout
An action taken by employers to prevent employees from working during a labor dispute, as a measure to pressure the union into concessions.
Picketing
Job action during a legal strike when employees circulate at the periphery of the job site to persuade others not to do business with the struck employer.
Workers' Compensation Benefits
An insurance type that offers medical benefits and substitutes wages for workers hurt while working.
Q56: One problem with deflation is that it
Q69: Employees at the university have negotiated a
Q92: In 1980, one Zimbabwean dollar was worth
Q99: Which of the following is considered expansionary
Q122: In order to promote price stability as
Q188: Refer to Figure 13.1. Suppose that the
Q217: Suppose the Bank of Canada decreases the
Q244: Give an example of an automatic stabilizer.Explain
Q256: Which of the following describes what the
Q268: How does expansionary monetary policy increase spending