Figure 13.1 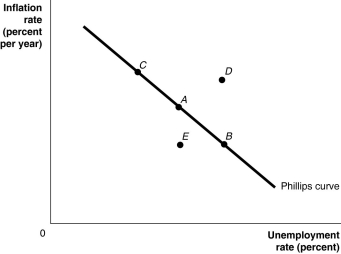 Alt text for Figure 13.1: In figure 13.1, a short-run Phillips curve.
Long description for Figure 13.1: The x-axis is labelled, unemployment rate percent, and the y-axis is labelled, inflation rate percent per year.A straight line labelled, Philips curve, begins at the top left corner and slopes down to the end of the x-axis.Point A is plotted half way along line Philips curve.Point B is plotted to the right of point A and point C is plotted is to the left of point A.Point D is plotted above this line, in the left center of the quadrant.Point E is plotted below this line, directly below point A.
-Refer to Figure 13.1.Suppose that the economy is currently at point A, and the unemployment rate at A is the natural rate.What policy would the Bank of Canada pursue if it wanted the economy to move to point C in the long run?
Definitions:
Emotional Attachments
The deep and enduring emotional connections that tie individuals to significant others in their lives.
Matching T-shirts
T-shirts with similar designs or messages worn by a group of individuals to signify unity or belonging.
Storge
Love that is slow-burning, peaceful, and affectionate.
Slow-Burning
A process or situation that develops or unfolds gradually over a period of time, often with delayed effects or outcomes.
Q35: In 2008, the U.S.Treasury Department and U.S.Federal
Q50: How does contractionary monetary policy affect net
Q67: Expansionary fiscal policy involves<br>A)increasing government purchases or
Q86: The federal government debt as a percentage
Q99: Ceteris paribus, a real depreciation of the
Q116: Over the past decade, many economists have
Q164: Refer to Figure 14.1.The depreciation of the
Q171: By the height of the U.S.housing bubble
Q274: Refer to Figure 14.4.Italians cut back on
Q275: Net foreign investment is equal to<br>A)capital inflows